MTF - Quantum Fibonacci ATR/ADR Levels & Targets**Indicator Overview:**
The *Quantum Fibonacci Wave Mechanics* indicator is a powerful tool designed to help traders identify dynamic support, resistance, and target levels based on the Average True Range (ATR) and Average Daily Range (ADR). This indicator leverages Fibonacci ratios to calculate precise entry and target levels, providing a comprehensive approach to market analysis.
**Key Features:**
- **Dynamic ATR/ADR Levels:** Automatically calculate and plot ATR and ADR-based support and resistance levels, offering insight into market volatility and potential reversal zones.
- **Fibonacci-Based Entry Levels:** Calculate Fibonacci entry levels using the 0.618 ratio, helping traders find optimal points to enter trades.
- **Customizable Target Levels:** Set up to three target levels based on Fibonacci ratios (1.618, 2.618, 3.618), allowing for precise trade management.
- **Stop Loss Lines:** Plot stop loss lines derived from ATR and ADR calculations, ensuring risk is managed effectively.
- **EMA Integration:** Optionally plot an Exponential Moving Average (EMA) line for additional trend confirmation.
- **Customizable Color Settings:** Adjust the colors of all levels and signals to fit your charting preferences.
- **Bar Coloring Based on Signals:** Automatically color bars based on the latest buy or sell signal for easier visual identification.
- **Label Display for Key Levels:** Display labels on the chart for important levels such as entry points, target levels, and stop loss lines.
**How Users Can Benefit:**
This indicator is ideal for traders who want to blend the precision of Fibonacci analysis with the robustness of ATR/ADR calculations. Whether you're a day trader looking for short-term entry points or a swing trader seeking reliable support and resistance levels, this indicator offers a versatile toolset for enhancing your trading decisions.
**Customization Instructions:**
The *Quantum Fibonacci Wave Mechanics* indicator is highly customizable to suit different trading styles and preferences. Below is a guide on how to adjust the settings:
1. **General Settings:**
- **ADR Length:** Define the lookback period for calculating the ADR.
- **EMA Length:** Set the period for the Exponential Moving Average (EMA).
- **Timeframe:** Select the timeframe for which the levels will be calculated (e.g., daily, weekly).
2. **Display Settings:**
- **Show ATR Levels:** Toggle the display of ATR-based support and resistance levels.
- **Show ADR Levels:** Toggle the display of ADR-based support and resistance levels.
- **Show EMA Line:** Toggle the display of the EMA line.
- **Show Stop Loss Lines:** Display stop loss levels derived from ATR and ADR.
- **Show Middle Level Line:** Show the middle level between buy and sell stop loss lines.
- **Show Fibonacci Entry Levels:** Enable the display of Fibonacci-based entry levels.
- **Show Entry Signals:** Plot buy and sell signals based on the crossover of the entry levels.
- **Show Target Levels:** Display up to three target levels for both buy and sell signals.
- **Color Bars Based on Last Signal:** Automatically color bars according to the last signal (buy or sell).
3. **Fibonacci Settings:**
- **Entry Ratio (Fibonacci):** Adjust the Fibonacci ratio used for calculating entry levels (default is 0.618).
- **Target Ratios (Fibonacci):** Set the Fibonacci ratios for up to three target levels (default ratios are 1.618, 2.618, and 3.618).
4. **Color Settings:**
- **Support Levels:** Customize the color of the support lines.
- **Resistance Levels:** Customize the color of the resistance lines.
- **Stop Loss Levels:** Set the color for stop loss lines (default is red).
- **Buy Target Levels:** Set the color for buy target levels (default is white).
- **Sell Target Levels:** Set the color for sell target levels (default is yellow).
5. **Label Display Settings:**
- **Show Labels for The Levels:** Toggle the display of labels for the various levels on the chart.
**Usage Tips:**
- **Combining with Other Indicators:** Use this indicator in conjunction with other technical indicators such as RSI, MACD, or Bollinger Bands to confirm signals.
- **Adjusting to Different Timeframes:** Customize the `timeframeInput` to analyze different market conditions, from intraday to long-term trading.
- **Risk Management:** Utilize the stop loss levels to manage risk effectively, ensuring your trades are protected against adverse market movements.
**Disclaimer:**
*This indicator is provided for educational purposes only and should not be considered financial advice. Trading in financial markets involves risk, and past performance does not guarantee future results. Always conduct your own research and consult with a licensed financial advisor before making any trading decisions. The creator of this indicator is not responsible for any financial losses that may occur from using this tool.*
Cari dalam skrip untuk "RSI MACD"

Entropy Volatility Index [CHE]I Entropy Volatility Index (EVI)
II An Experimental Script for Measuring Market Volatility
III Introduction
The Entropy Volatility Index (EVI) is an experimental indicator based on concepts from thermodynamics and information theory. The goal of the EVI is to quantify market uncertainty and volatility by calculating the entropy of price changes.
IV Basic Concepts
Entropy in Thermodynamics
Entropy is a measure of disorder or randomness in a system.
The second law of thermodynamics states that entropy in a closed system tends to increase over time.
Entropy in Information Theory
In information theory, entropy measures the uncertainty or information content of a random variable.
The entropy H of a random variable X with probability distribution P(x) is calculated as:
H(X) = -∑ P(x) log P(x)
V Derivation of the EVI
Calculation of Price Changes
Absolute price changes are calculated to serve as the basis for probability calculations.
Creation of the Histogram
A histogram is created and initialized to count the frequency of price changes.
Updating the Histogram
The histogram is updated by counting the frequency of each price change.
Calculation of Probabilities
The probabilities of the price changes are calculated based on their frequencies in the histogram.
Calculation of Entropy
Entropy is calculated using the probabilities of price changes. Higher entropy indicates higher uncertainty or disorder in the market.
Plotting the Indicator
The EVI is plotted to visually represent market volatility and uncertainty.
VI Interpretation of the EVI
High EVI Values
High Volatility: Strong and irregular price movements.
High Uncertainty: Increased market uncertainty.
Possible Market Turning Points: Indicators of potential trend changes.
Low EVI Values
Low Volatility: More consistent and predictable price movements.
Stability: More stable market phases.
Trend Consistency: Indicators of stable trends or sideways movements.
VII Conclusion
The Entropy Volatility Index (EVI) is an experimental script that applies concepts from thermodynamics and information theory to measure market volatility. It offers a new perspective on market uncertainty and can be used as an additional tool for traders.
VIII Example Use Cases
Identifying Volatile Phases: Use the EVI to identify periods of high volatility and prepare for potential rapid price movements.
Risk Management: Adjust your risk management strategy based on the EVI. During high EVI periods, consider hedging positions or adjusting position sizes.
Complementing Other Indicators: Combine the EVI with other technical indicators (e.g., RSI, MACD) for a more comprehensive view of market conditions.
I hope this experimental script provides valuable insights. Thank you for your feedback and suggestions for improvement.
Best regards,
Chervolino
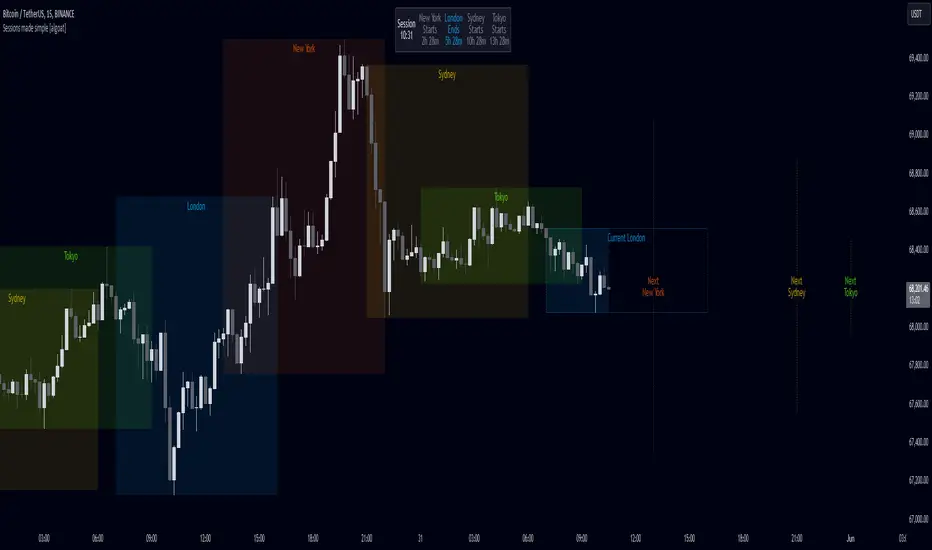
Sessions made simple [algoat]The indicator — by default — provides a clear and concise representation of the four major global trading sessions. Each session is distinctly marked on your trading chart, helping you visualize the specific time periods when these markets are most active. Whether you're a day trader looking to exploit intraday volatility or a long-term investor wanting to understand broader market trends, the Market Sessions feature can be a useful tool in your trading toolkit. The indicator comes with a dashboard, displaying the remaining time until the session end if the session is active and next start if the session is inactive.
Don't forget to align indicator timezone settings according to your region!
⭐ Key Features:
Visual Session Markers
Each of the four trading sessions is fully configurable by visibility, title, time range, and more. The enabled sessions are distinctly marked on the chart with customizable colors, various display options, current sessions' end time and next sessions' start time.
Session Dashboard
The indicator includes a dashboard that displays the remaining time until the session end if the session is active, and the next start time if the session is inactive. This feature provides a quick reference for traders to plan their trading activities.
Timezone Settings
Easily align the indicator's timezone settings with your region by entering your time zone's offset in UTC hours. This ensures that the session times are accurately displayed according to your local time.
Weekend Visibility
Optionally, you can choose to display or hide weekend sessions based on your trading preferences.
Flexible Configuration
The indicator allows for various configurations such as the maximum timeframe for session display, the position of the dashboard, and the text size for better readability.
══════════════════
🧠 General advice
Trading effectively requires a range of techniques, experience, and expertise. From technical analysis to market fundamentals, traders must navigate multiple factors, including market sentiment and economic conditions. However, traders often find themselves overwhelmed by market noise, making it challenging to filter out distractions and make informed decisions. By integrating multiple analytical approaches, traders can tailor their strategies to fit their unique trading styles and objectives.
Confirming signals with other indicators
As with all technical indicators, it is important to confirm potential signals with other analytical tools, such as support and resistance levels, as well as indicators like RSI, MACD, and volume. This helps increase the probability of a successful trade.
Use proper risk management
When using this or any other indicator, it is crucial to have proper risk management in place. Consider implementing stop-loss levels and thoughtful position sizing.
Combining with other technical indicators
Integrate this indicator with other technical indicators to develop a comprehensive trading strategy and provide additional confirmation.
Conduct Thorough Research and Backtesting
Ensure a solid understanding of the indicator and its behavior through thorough research and backtesting before making trading decisions. Consider incorporating fundamental analysis and market sentiment into your trading approach.
══════════════════
⭐ Conclusion
We hold the view that the true path to success is the synergy between the trader and the tool, contrary to the common belief that the tool itself is the sole determinant of profitability. The actual scenario is more nuanced than such an oversimplification. A word to the wise is enough: developed by traders, for traders — pioneering innovations for the modern era.
Risk Notice
Everything provided by algoat — from scripts, tools, and articles to educational materials — is intended solely for educational and informational purposes. Past performance does not assure future returns.
SMC Community [algoat] — Smart Money ConceptsEmpower your trading with the core principles of the Smart Money Concepts through interactive features and highly customizable settings.
The indicator's strength lies in the unique SMC Core algorithm, a calculation based on real price action data, capturing every tick from small intraday fluctuations to significant high timeframe movements.
algoat SMC Core is our continually evolving, specialized structure mapping algorithm, serving as the backbone of our price action related publications.
⭐ Key Features
Swing Market Structure: Change of Character, Break of Structure
Recognize and visualize real-time market structures with swing elements. Identify and mark key structural changes in the market to visually highlight shifts in market trends and patterns. This feature is designed to alert you to significant changes in the market's behavior, signaling a potential shift from accumulation to distribution phases, or vice versa. It helps traders adapt their strategies based on evolving market dynamics.
Order Flow: Structure Fractal
Connect the successive structural high and low levels, visualizing the intricate flow of market movements. This feature highlights fractal structures within the market, enabling traders to detect significant price action patterns.
Structure Range: Determine Discount, Premium, and Equilibrium Zones
This feature provides a unique way of visualizing price areas where a security could be overbought or oversold (premium or discount zones) and where the price is expected to be fair and balanced (equilibrium zone). Distance from the current price is displayed in percentage terms, which can assist traders with crucial data for risk management and strategic planning. The Range function helps you identify the most favorable price zones for entries and set your stop-loss and take-profit levels more accurately.
Liquidity Grabs: Reveal Hidden Manipulation Attempts
Identify uncovered market areas where high liquidity trading may take place. Liquidity Grabs help track "smart money" footprints by identifying levels where large institutional traders may have induced liquidity traps. Understanding these traps can aid in avoiding false market moves and optimizing trade entries.
Institutional Interest Zones: Order Blocks and Fair Value Gaps
Uncover areas where bigger orders may be lined up. Reveal zones of interest ordered by volume strength. Receive warnings about market price imbalances.
▸ Order Blocks pinpoint crucial zones where large institutional investors ("smart money") have shown strong buying or selling interest recently. These blocks can serve as a tool for identifying key areas for potential trade entries or exits.
▸ Fair Value Gaps detect discrepancies between the perceived market value and the actual market price, revealing potential areas for price correction. With its mitigation settings, you can fine-tune the FVG detection according to the magnitude of value misalignment you consider significant.
Mitigation types dictate how price interacts with a zone, with order blocks requiring a close through (indicating stronger price movement) and fair value gaps requiring a wick through (hinting at weak rejection).
══════════════════
⭐ Why SMC?
In the ever-evolving trading landscape, mainstream methods and strategies can quickly become outdated as they are widely adopted. Liquidity is constantly sought after, and the best source for this is exploring and exploiting trading strategies that are widely accepted and applied. Currently, one of these strategies is the SMC (Supply, Demand, and Price Action).
It's no coincidence that our educational materials incorporate concepts such as liquidity grabs (LG) and Smart Money Traps (SMT). As the application of SMC gains popularity among retail traders, trading with this approach becomes more challenging. Therefore, the recent focus has been on reforming the SMC methodology, as it is the only method that relies on real price movements and will always work when applied correctly.
The indicator reflects our personal use and deep comprehension of Smart Money Concepts. It provides streamlined tools for tracking algorithmic trends with modern visualizations, without unnecessary clutter.
▸ What does the proper application of SMC entail?
Many SMC traders associate their key areas of interest with the market structure, which is generally considered acceptable. However, depending solely on a single foundation can lead to significant deviations, which may cause notable impacts on trading results. Moreover, if the basis for the market structure calculation is inaccurate, the consequences can be even more severe. It's akin to risking money on a lottery ticket, believing it will be a winner.
Our methodology is different, and it may ensure longevity in the financial markets. The structure remains crucial, but it is not the sole foundation of everything; instead, it serves as a validation tool. Each calculation, such as order blocks (OB), Fair Value Gaps (FVG), liquidity grabs (LG), range analysis, and more, is independent and unique, separate from the structure. However, validation must ultimately come from the structure itself.
We employ individual and high-quality filters: before a function calculation is validated by the structure, it must undergo rigorous testing based on its own set of validation conditions. This approach aims to enhance robustness and accuracy, providing traders with a reliable framework for making informed trading decisions.
▸ An example of structure validation: Order Block with "Swing Sensitivity"
These order blocks will only be displayed and utilized by the script if there is a swing structure validation with a valid break. In other words, the presence of a confirmed swing Change of Character (ChoCh) or Break of Structure (BoS) is essential for the Order Block to be considered valid and relevant.
This approach ensures that the order blocks are aligned with the overall market structure and are not based on isolated or unreliable price movements. Whether it's Fair Value Gaps (FVG), Liquidity Grabs (LG), Range calculations, or other functionalities, the same underlying principle holds true. The background structure calculation serves as a validation mechanism for the data and insights generated by these functions, ensuring they adhere to the specific criteria and rules established within our methodology. By incorporating this robust validation process, traders can have confidence in the reliability and accuracy of the information provided by the indicator, allowing them to make informed trading decisions based on validated data and analysis.
══════════════════
👉 Usage - the general approach
Determine your trading style and build your basic strategy:
The indicator helps you understand your trading style, whether it's swing trading, scalping or another approach. By analyzing the SMC indicator, you gain valuable information about potential market trends, entry and exit points, and overall market sentiment.
Steps:
Identify Trading Style: Determine whether you are a swing trader, scalper, or long-term investor. This will influence how you use the indicator.
Analyze Market Trends: Use the SMC indicator to observe market trends and identify potential entry and exit points.
Adapt Strategies: Adjust your strategies based on the market dynamics revealed by the SMC indicator, such as changes in order flow or market structure.
👉 Example of usage
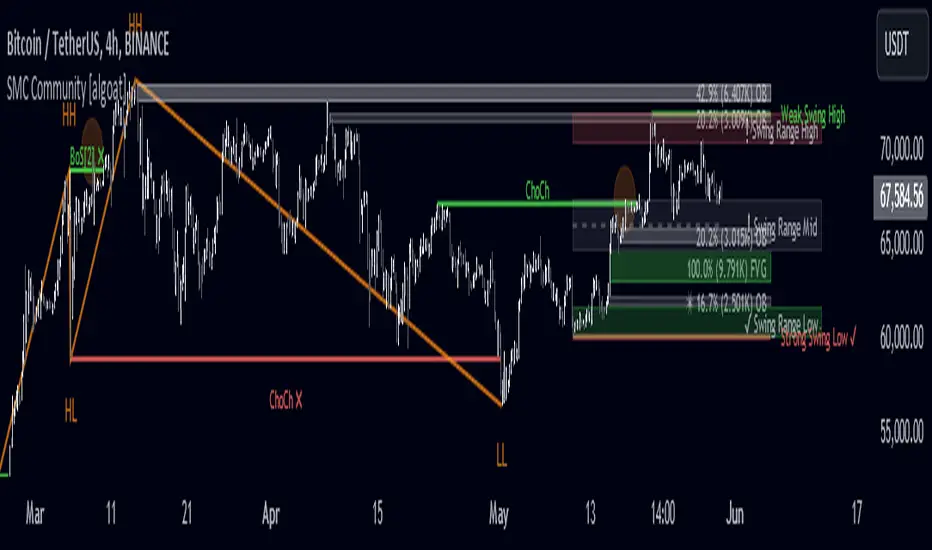
In the following chart, you'll notice how we've utilized the indicator to formulate a strategic trading approach. We've employed Order Blocks equipped with volume parameters to identify crucial market zones. Simultaneously, we've leveraged swing/internal market structures to gain insights into potential long- and short-term market turnarounds. Lastly, we've examined trend line liquidity zones to pinpoint probable impulses and breakouts within ongoing trends.
Now we can see how the price descended to the order block with the highest volume, which we had previously marked as our point of interest for an entry. As the price closed below the median Order Block, we noted its mitigation. After an internal CHoCH, it's directing us towards the main Order Block as a target.
══════════════════
🧠 General advice
Trading effectively requires a range of techniques, experience, and expertise. From technical analysis to market fundamentals, traders must navigate multiple factors, including market sentiment and economic conditions. However, traders often find themselves overwhelmed by market noise, making it challenging to filter out distractions and make informed decisions. By integrating multiple analytical approaches, traders can tailor their strategies to fit their unique trading styles and objectives.
Confirming signals with other indicators
As with all technical indicators, it is important to confirm potential signals with other analytical tools, such as support and resistance levels, as well as indicators like RSI, MACD, and volume. This helps increase the probability of a successful trade.
Use proper risk management
When using this or any other indicator, it is crucial to have proper risk management in place. Consider implementing stop-loss levels and thoughtful position sizing.
Combining with other technical indicators
Integrate this indicator with other technical indicators to develop a comprehensive trading strategy and provide additional confirmation.
Conduct Thorough Research and Backtesting
Ensure a solid understanding of the indicator and its behavior through thorough research and backtesting before making trading decisions. Consider incorporating fundamental analysis and market sentiment into your trading approach.
══════════════════
⭐ Conclusion
We hold the view that the true path to success is the synergy between the trader and the tool, contrary to the common belief that the tool itself is the sole determinant of profitability. The actual scenario is more nuanced than such an oversimplification. A word to the wise is enough: developed by traders, for traders — pioneering innovations for the modern era.
Risk Notice
Everything provided by algoat — from scripts, tools, and articles to educational materials — is intended solely for educational and informational purposes. Past performance does not assure future returns.
Sticky Notes, Checklist, To-do, Journal [algoat]I forgot to bring my notes again...
Ever feel like your trading notes are all over the place, much like your portfolio after a market dip? Worry not! With this script, you'll have all your trading notes, tasks, and brilliant (or not so brilliant) ideas neatly organized right on your chart. It's like having a sticky note board, but way cooler and without the risk of paper cuts.
⭐ Features :
To-Do Lists
Keep track of tasks with satisfying checkmarks for those dopamine hits.
Journal Entries
Document your market insights, trade plans, or just random thoughts. "I forgot something" – we've all been there.
Due Dates
Never miss an important deadline again. Red alert for overdue tasks because procrastination is a trader's worst enemy.
Customization
Choose the size and position of your notes because one size doesn't fit all.
Perfect for the organized trader who loves a bit of fun or the chaotic one who needs a bit of structure. Embrace the power of notes and stay on top of your trading game!
══════════════════
🧠 General advice
Trading effectively requires a range of techniques, experience, and expertise. From technical analysis to market fundamentals, traders must navigate multiple factors, including market sentiment and economic conditions. However, traders often find themselves overwhelmed by market noise, making it challenging to filter out distractions and make informed decisions. By integrating multiple analytical approaches, traders can tailor their strategies to fit their unique trading styles and objectives.
Confirming Signals with other indicators
As with all technical indicators, it is important to confirm potential signals with other analytical tools, such as support and resistance levels, as well as indicators like RSI, MACD, and volume. This helps increase the probability of a successful trade.
Use proper risk management
When using this or any other indicator, it is crucial to have proper risk management in place. Consider implementing stop-loss levels and thoughtful position sizing.
Combining with other technical indicators
The indicator can be effectively used alongside other technical indicators to create a comprehensive trading strategy and provide additional confirmation.
Keep in mind
Thorough research and backtesting are essential before making any trading decisions. Furthermore, it's crucial to have a solid understanding of the indicator and its behavior. Additionally, incorporating fundamental analysis and considering market sentiment can be vital factors to take into account in your trading approach.
══════════════════
⭐ Conclusion
We hold the view that the true path to success is the synergy between the trader and the tool, contrary to the common belief that the tool itself is the sole determinant of profitability. The actual scenario is more nuanced than such an oversimplification. A word to the wise is enough: developed by traders, for traders — pioneering innovations for the modern era.
Risk Notice
Everything provided by algoat — from scripts, tools, and articles to educational materials — is intended solely for educational and informational purposes. Past performance does not assure future returns.

Dynamic Auto Fibonacci Retracement + SMA
Explanation of the Script:
This script, "Dynamic Auto Fibonacci Retracement + SMA," combines Fibonacci retracement levels with Simple Moving Averages (SMA) to create a comprehensive tool for technical analysis. The purpose of this script is to help traders identify potential support and resistance levels, determine trend direction, and identify dynamic retracement points across multiple timeframes. By combining these indicators, traders gain a holistic view of market conditions, enabling them to make more informed trading decisions.
How Components Work Together:
Fibonacci Retracement Levels:
Automatically calculated based on user-defined lookback periods, these levels are plotted to help identify key areas where price might reverse or continue its trend. The script uses persistent arrays to manage and plot Fibonacci lines and labels, dynamically adjusting them as new data comes in. This ensures that traders always have up-to-date retracement levels on their charts.
Simple Moving Averages (SMA):
SMAs are overlaid on the chart to indicate the trend direction. Different SMA periods can be set for various timeframes, providing a multi-timeframe analysis that helps traders understand the broader market context. The SMA is calculated using the ta.sma function, and users can customize the lookback period to fit their trading strategy.
Trend Analysis:
The script incorporates additional indicators such as RSI, MACD, Bollinger Bands, and ADX to confirm trend direction. These indicators are used in conjunction to provide a robust framework for identifying whether the market is in an uptrend, downtrend, or moving sideways. This multi-indicator approach helps reduce false signals and improve trend detection accuracy.
Support and Resistance Detection:
The script highlights key support and resistance levels by identifying recent highs and lows. This feature provides traders with additional context for potential price reversals and helps them make more strategic trading decisions. Support and resistance levels are plotted using the ta.valuewhen function, which ensures that they are accurately identified and displayed on the chart.
Higher Timeframe Analysis:
By incorporating higher timeframe Fibonacci levels and SMAs, the script allows traders to consider broader market trends. This higher timeframe analysis helps traders align their short-term trades with the overall market direction, improving the likelihood of successful trades. The script uses the request.security function to fetch higher timeframe data, ensuring that the analysis is accurate and relevant.
Customizable Settings:
The script offers a wide range of customizable settings, allowing users to adjust colors, styles, and advanced features to tailor the script to their specific trading needs and preferences. This flexibility makes the script suitable for various trading strategies and styles, from scalping to long-term investing. Users can adjust settings such as the lookback period, SMA period, line colors, and more, ensuring that the script fits seamlessly into their existing trading setup.
How to Use the Script:
Set Lookback Periods: Adjust the lookback periods for Fibonacci levels and SMAs based on your trading strategy.
Customize Appearance: Use the color and style settings to match the script's appearance to your charting preferences.
Enable Advanced Features: Turn on features such as support/resistance detection and higher timeframe analysis to enhance your market analysis.
Monitor Trend Direction: Use the combined indicators to confirm trend direction and identify potential entry and exit points.
Adjust Settings: Fine-tune the script's settings to align with your specific trading needs and preferences.
By following these steps, traders can effectively use the "Dynamic Auto Fibonacci Retracement + SMA" script to improve their technical analysis and make more informed trading decisions. This script's unique combination of indicators and customizable features provides a powerful tool for traders looking to enhance their market analysis and trading strategies.

Linear Regression Forecast Tool [Daveatt]Hello traders,
Navigating through the financial markets requires a blend of analysis, insight, and a touch of foresight.
My Linear Regression Forecast Tool is here to add that touch of foresight to your analysis toolkit on TradingView!
Linear Regression is the heart of this tool, a statistical method that explores the relationship between a dependent variable and one (or more) independent variable(s).
In simpler terms, it finds a straight line that best fits a set of data points.
This "line of best fit" then becomes a visual representation of the relationship in the data, providing a basis for making predictions.
Here's what the Linear Regression Forecast Tool brings to your trading table:
Multiple Indicator Choices: Select from various market indicators like Simple Moving Averages, Bollinger Bands, or the Volume Weighted Average Price as the basis for your linear regression analysis.
Customizable Forecast Periods: Define how many periods ahead you want to forecast, adjusting to your analysis needs, whether that's looking 5, 7, or 10 periods into the future.
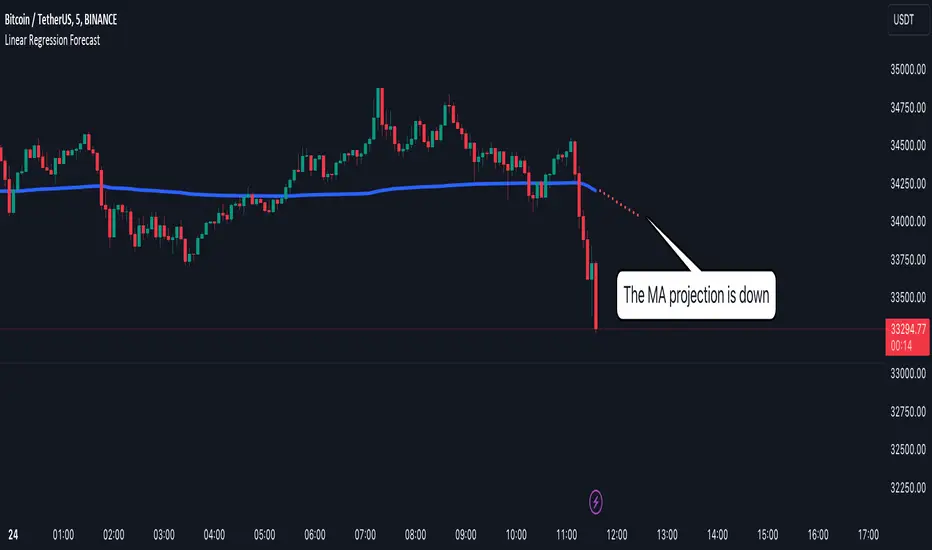
On-Chart Forecast Points: The tool plots the forecasted points on your chart, providing a straightforward visual representation of potential future values based on past data.
In this script:
1. We first calculate the indicator using the specified period.
2. We then use the ta.linreg function to calculate a linear regression curve fitted to the indicator over the last Period bars.
3. We calculate the slope of the linear regression curve using the last two points on the curve.
We use this slope to extrapolate the linear regression curve to forecast the next X points of the indicator.
4/ Finally, we use the plot function to plot the original indicator and the forecasted points on the chart, using the offset parameter to shift the forecasted points to the right (into the future).
This method assumes that the trend represented by the linear regression curve will continue, which may not always be the case, especially in volatile or changing market conditions.
Examples:
Works with a moving average
Works with a Bollinger band
The code can be adapted to work with any other indicator (imagine RSI, MACD, other Moving Average Type, PSAR, Supertrend, etc...)
Conclusion
The Linear Regression Forecast Tool doesn't promise to tell the future but provides a structured way to visualize possible future price trends based on historical data. I
Remember, no tool can predict market conditions with certainty.
It's always advisable to corroborate findings with other analysis methods and stay updated with market news and events.
Happy trading!
DIY Custom Strategy Builder [ZP] - v1DISCLAIMER:
This indicator as my first ever Tradingview indicator, has been developed for my personal trading analysis, consolidating various powerful indicators that I frequently use. A number of the embedded indicators within this tool are the creations of esteemed Pine Script developers from the TradingView community. In recognition of their contributions, the names of these developers will be prominently displayed alongside the respective indicator names. My selection of these indicators is rooted in my own experience and reflects those that have proven most effective for me. Please note that the past performance of any trading system or methodology is not necessarily indicative of future results. Always conduct your own research and due diligence before using any indicator or tool.
===========================================================================
Introducing the ultimate all-in-one DIY strategy builder indicator, With over 30+ famous indicators (some with custom configuration/settings) indicators included, you now have the power to mix and match to create your own custom strategy for shorter time or longer time frames depending on your trading style. Say goodbye to cluttered charts and manual/visual confirmation of multiple indicators and hello to endless possibilities with this indicator.
What it does
==================
This indicator basically help users to do 2 things:
1) Strategy Builder
With more than 30 indicators available, you can select any combination you prefer and the indicator will generate buy and sell signals accordingly. Alternative to the time-consuming process of manually confirming signals from multiple indicators! This indicator streamlines the process by automatically printing buy and sell signals based on your chosen combination of indicators. No more staring at the screen for hours on end, simply set up alerts and let the indicator do the work for you.
Available indicators that you can choose to build your strategy, are coded to seamlessly print the BUY and SELL signal upon confirmation of all selected indicators:
EMA Filter
2 EMA Cross
3 EMA Cross
Range Filter (Guikroth)
SuperTrend
Ichimoku Cloud
SuperIchi (LuxAlgo)
B-Xtrender (QuantTherapy)
Bull Bear Power Trend (Dreadblitz)
VWAP
BB Oscillator (Veryfid)
Trend Meter (Lij_MC)
Chandelier Exit (Everget)
CCI
Awesome Oscillator
DMI ( Adx )
Parabolic SAR
Waddah Attar Explosion (Shayankm)
Volatility Oscillator (Veryfid)
Damiani Volatility ( DV ) (RichardoSantos)
Stochastic
RSI
MACD
SSL Channel (ErwinBeckers)
Schaff Trend Cycle ( STC ) (LazyBear)
Chaikin Money Flow
Volume
Wolfpack Id (Darrellfischer1)
QQE Mod (Mihkhel00)
Hull Suite (Insilico)
Vortex Indicator
2) Overlay Indicators
Access the full potential of this indicator using the SWITCH BOARD section! Here, you have the ability to turn on and plot up to 14 of the included indicators on your chart. Simply select from the following options:
EMA
Support/Resistance (HeWhoMustNotBeNamed)
Supply/ Demand Zone ( SMC ) (Pmgjiv)
Parabolic SAR
Ichimoku Cloud
Superichi (LuxAlgo)
SuperTrend
Range Filter (Guikroth)
Average True Range (ATR)
VWAP
Schaff Trend Cycle ( STC ) (LazyBear)
PVSRA (TradersReality)
Liquidity Zone/Vector Candle Zone (TradersReality)
Market Sessions (Aurocks_AIF)
How it does it
==================
To explain how this indictor generate signal or does what it does, its best to put in points.
I have coded the strategy for each of the indicator, for some of the indicator you will see the option to choose strategy variation, these variants are either famous among the traders or its the ones I found more accurate based on my usage. By coding the strategy I will have the BUY and SELL signal generated by each indicator in the backend.
Next, the indicator will identify your selected LEADING INDICATOR and the CONFIRMATION INDICATOR(s).
On each candle close, the indicator will check if the selected LEADING INDICATOR generates signal (long or short).
Once the leading indicator generates the signal, then the indicator will scan each of the selected CONFIRMATION INDICATORS on candle close to check if any of the CONFIRMATION INDICATOR generated signal (long or short).
Until this point, all the process is happening in the backend, the indicator will print LONG or SHORT signal on the chart ONLY if LEADING INDICATOR and all the selected CONFIRMATION INDICATORS generates signal on candle close. example for long signal, the LEADING INDICATOR and all selected CONFIRMATION INDICATORS must print long signal.
The dashboard table will show your selected LEADING and CONFIRMATION INDICATORS and if LEADING or the CONFIRMATION INDICATORS have generated signal. Signal generated by LEADING and CONFIRMATION indicator whether long or short, is indicated by tick icon ✔. and if any of the selected CONFIRMATION or LEADING indicator does not generate signal on candle close, it will be indicated with cross symbol ✖.
how to use this indicator
==============================
Using the indicator is pretty simple, but it depends on your goal, whether you want to use it for overlaying the available indicators or using it to build your strategy or for both.
To use for Building your strategy: Select your LEADING INDICATOR, and then select your CONFIRMATION INDICATOR(s). if on candle close all the indicators generate signal, then this indicator will print SHORT or LONG signal on the chart for your entry. There are plenty of indicators you can use to build your strategy, some indicators are best for longer time frame setups while others are responsive indicators that are best for short time frame.
To use for overlaying the indicators: Open the setting of this indicator and scroll to the SWITCHBOARD section, from there you can select which indicator you want to plot on the chart.
For each of the listed indicators, you have the flexibility to customize the settings and configurations to suit your preferences. simply open indicator setting and scroll down, you will find configuration for each of the indicators used.
I will also release the Strategy Backtester for this indicator soon.

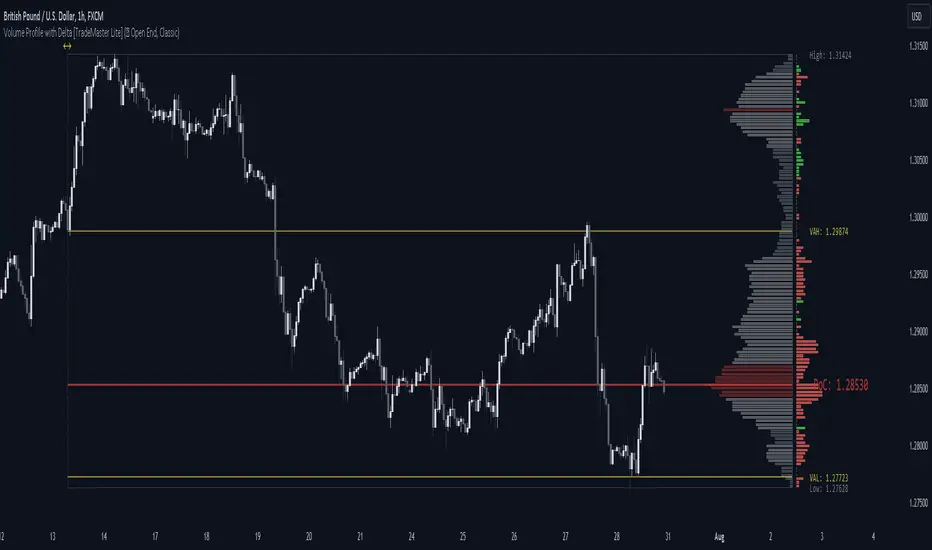
Volume Profile with Delta [TradeMaster Lite]The indicator estimates and displays the total traded volume and it's delta** at each price level during the user-defined period. It can be used to identify key support and resistance levels, determine logical take profit and stop loss levels, identify balanced and unbalanced markets and determine trend strength. The indicator offers different approaches to visualize the volume profile and can be chosen based on your preferred trading strategy and analysis method. The position and size of the Volume Profile is fully customizable, it can even be flipped if needed!
Three different display types (cosmetic effect only):
Classic
Compact
Modern
The Lite version offers three different range types:
Visible Range: displays the volume profile for the visible range of bars or candles on the chart. It adjusts dynamically as you change the chart view making it ideal for the modern trader who values both precision and simplicity.
Open End: displays the volume profile from a specific start date without a defined end, including real delta data. It provides an overview of the volume activity across all price levels of the examined period.
Fixed End: lets you define a specific start and end point for the volume profile. It can be useful if you want to analyze the volume activity within a specific time period or price range.
👉 Usage
The Volume Profile is a histogram that shows the estimated trading volume at certain price levels, how much was sold and how much was bought of the asset. The longer the histogram, the greater the trading volume at that price level. The Delta estimates which side was dominant at that price level and by how much.
To make the most out of the indicator, you can look for
pullbacks to high volume nodes or value areas,
initial equilibrium pullbacks,
buy or sell opportunities for price reversals,
institutional order flow.
The largest histogram node is called the Point of Control (POC). It is the estimated real market price of a coin. There's a common belief that when the price is above this point, the market sentiment is bullish, and when it's below, the sentiment turns bearish. It can act as a strong support if the price is above it and as strong resistance if the price is below it.
Price action usually finds the most support and resistance and the edge of the high volume areas. The indicator can mark these as VAH and VAL (Value Area High and Low).
In addition to the indication of support and resistance zones, the volume profile can also be used to infer the speed of price movements. At levels where there is little trading volume, faster and more volatile price movements are expected. In such scenarios the price may fall or rise faster to the next high volume zone.
👉 General advice
Confirming Signals with other indicators:
As with all technical indicators, it is important to confirm potential signals with other analytical tools, such as support and resistance levels, as well as indicators like RSI, MACD, and volume. This helps increase the probability of a successful trade.
Use proper risk management:
When using this or any other indicator, it is crucial to have proper risk management in place. Consider implementing stop-loss levels and thoughtful position sizing.
Combining with other technical indicators:
The indicator can be effectively used alongside other technical indicators to create a comprehensive trading strategy and provide additional confirmation.
Keep in Mind:
Thorough research and backtesting are essential before making any trading decisions. Furthermore, it's crucial to have a solid understanding of the indicator and its behavior. Additionally, incorporating fundamental analysis and considering market sentiment can be vital factors to take into account in your trading approach.
Limitations:
The Lite version shows simple delta with current timeframe volume data.
The indicators within the TradeMaster Lite package aim for simplicity and efficiency, while retaining their original purpose and value. Some settings, functions or visuals may be simpler than expected.
**The Delta estimates which side was dominant at that price level and by how much. It is the difference between bull and bear volume of the candle.
⭐ Conclusion
We hold the view that the true path to success is the synergy between the trader and the tool, contrary to the common belief that the tool itself is the sole determinant of profitability. The actual scenario is more nuanced than such an oversimplification. Our aim is to offer useful features that meet the needs of the 21st century and that we actually use.
🛑 Risk Notice:
Everything provided by trademasterindicator – from scripts, tools, and articles to educational materials – is intended solely for educational and informational purposes. Past performance does not assure future returns.
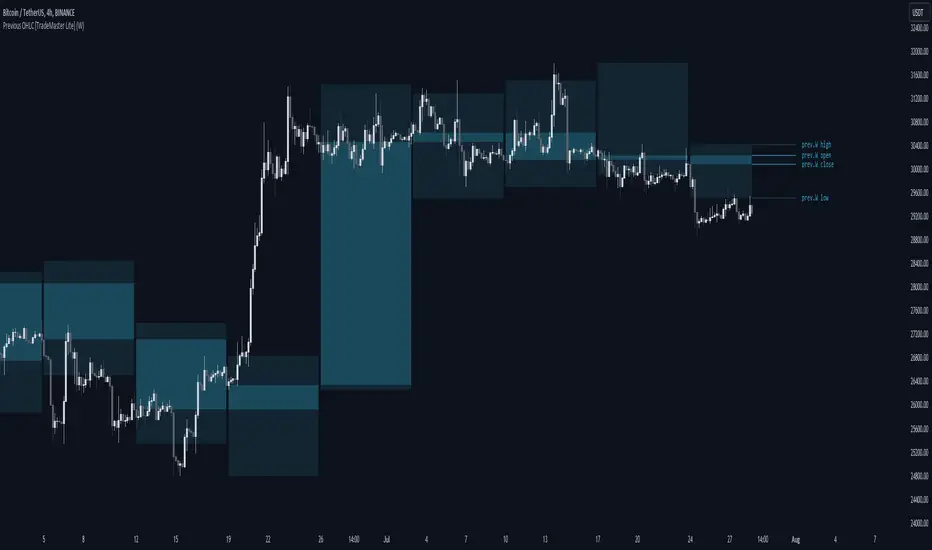
Previous OHLC Levels [TradeMaster Lite]In trading, the “Previous Open/High/Low/Close” (or previous OHLC) refers to the opening, high, low and closing price of the instrument in the previous period. These prices are typically used in technical analysis to identify trends and patterns and to make trading decisions. Some traders may also use the differences between the opening, high, low and closing prices to make trading decisions. For example, the difference between the closing and opening price (the so-called “true body”) and the high and low price (the so-called “upper shadow” and “lower shadow”) can indicate the strength of a trend, whether the bulls or bears are controlling the market, and can also give an idea of market volatility, and are also used as support and resistance levels.
Previous Open: shows the opening price of the previous period. It's the price at which the market first started trading in that period.
Previous High: represents the highest price reached during the previous period. It can act as a resistance level for the current period.
Previous Low: indicates the lowest price hit during the previous period. It can serve as a support level in the current period.
Previous Close: the last price at which the asset traded during the previous period. It's often considered the most accurate reflection of the market sentiment at the end of that period.
These values provide a summary of the previous trading period's price action, giving you a baseline for comparing current price movements. They can help in understanding the market's direction and identifying potential support and resistance levels. It is important to keep in mind that, like any other technical indicator, Previous OHLC does not give a definitive indication of future market direction and should be used in conjunction with other analytical tools, as well as fundamental analysis and market sentiment. It is also important to have appropriate risk management in place.
👉 General advice
Confirming Signals with other indicators:
As with all technical indicators, it is important to confirm potential signals with other analytical tools, such as support and resistance levels, as well as indicators like RSI, MACD, and volume. This helps increase the probability of a successful trade.
Use proper risk management:
When using this or any other indicator, it is crucial to have proper risk management in place. Consider implementing stop-loss levels and thoughtful position sizing.
Combining with other technical indicators:
The indicator can be effectively used alongside other technical indicators to create a comprehensive trading strategy and provide additional confirmation.
Keep in Mind:
Thorough research and backtesting are essential before making any trading decisions. Furthermore, it's crucial to have a solid understanding of the indicator and its behavior. Additionally, incorporating fundamental analysis and considering market sentiment can be vital factors to take into account in your trading approach.
Limitations:
This is a lagging indicator. Please note that the displayed values are delayed by the chosen timeframe on historical bars and show the values from the previous period on the current bar.
The indicators within the TradeMaster Lite package aim for simplicity and efficiency, while retaining their original purpose and value. Some settings, functions or visuals may be simpler than expected.
⭐ Conclusion
We hold the view that the true path to success is the synergy between the trader and the tool, contrary to the common belief that the tool itself is the sole determinant of profitability. The actual scenario is more nuanced than such an oversimplification. Our aim is to offer useful features that meet the needs of the 21st century and that we actually use.
🛑 Risk Notice:
Everything provided by trademasterindicator – from scripts, tools, and articles to educational materials – is intended solely for educational and informational purposes. Past performance does not assure future returns.
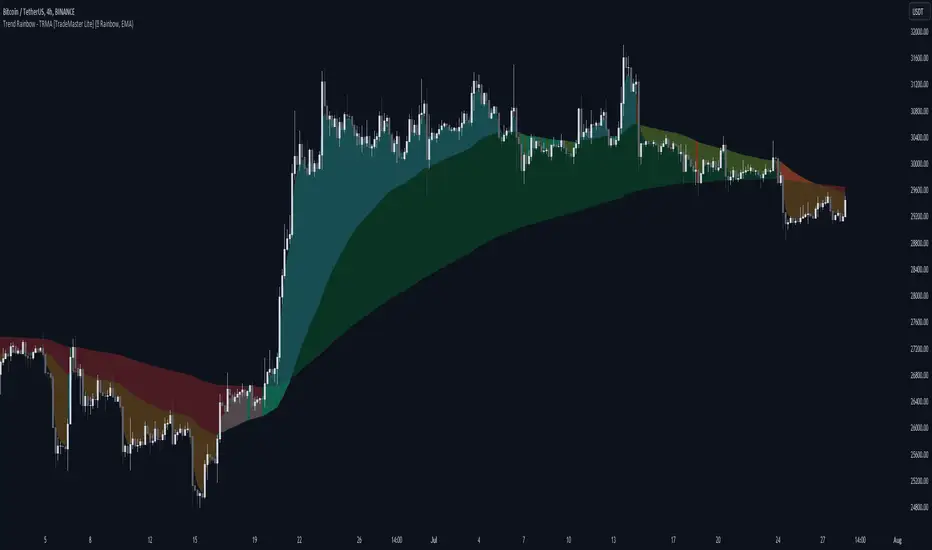
Trend Rainbow Moving Averages [TradeMaster Lite]The Trend Rainbow indicator is a simple technical analysis tool that uses moving averages to identify trends and potential buy and sell signals. It utilizes simple visualization techniques to present trend information in an intuitive, easily interpretable manner. This 21st-century tool is tailored for the modern trader who values both precision and simplicity.
The indicator uses our unique TRMA method to define short-term, intermediate, and long-term market trends. The TRMA (Trend Rainbow Moving Averages) is our own invention: a complex but flexible moving average matrix calculation that is designed to measure market trend direction, strength and shifting. Traders have the flexibility to choose from four types of moving average calculation bases to create a "rainbow".
👉 Example of usage:
General trend direction of the asset can be identified by looking at the slope of the rainbow. If the rainbow is generally pointing up, the asset is in an uptrend, if it is pointing down, the asset is in a downtrend. The indicator can also be used to assess the strength of a trend, identify potential resistance and support levels, and manage risk.
The Lite version of the indicator has 2 main trends to help you assess information about the direction and strength of asset's trend:
Intermediate trend: teal for bull trend, orange for bear trend.
Long-term trend: green for bull trend, red for bear trend.
Left side:
The image clearly shows that during the decline, the bearish intermediate trend was tested multiple times, acting as a resistance. This is a sign of weakness in the intermediate trend. The price did not have enough strength test the long-term trend yet, which is a sign that the long-term trend is still bearish.
Right side:
The intermediate trend first turned into neutral, then bullish. This is a sign of strength in the short-term and medium-term trends. This strength did not weaken and eventually. By maintaining the bullish intermediate trend, the long term trend was able to turn bullish again and a strong uptrend is now unfolding. This is a sign that the long-term trend is changing to bullish.
The Trend Rainbow also helps in risk management. On the right side of the chart the price is making a very steep move and both the intermediate and long-term trends are very far away from the current price. This shows us potential risk and the possibility of a deeper pullback. Trend edges can be used as potential entries or targets, depending on the situation.
👉 General advice
Confirming Signals with other indicators:
As with all technical indicators, it is important to confirm potential signals with other analytical tools, such as support and resistance levels, as well as indicators like RSI, MACD, and volume. This helps increase the probability of a successful trade.
Use proper risk management:
When using this or any other indicator, it is crucial to have proper risk management in place. Consider implementing stop-loss levels and thoughtful position sizing.
Combining with other technical indicators:
The indicator can be effectively used alongside other technical indicators to create a comprehensive trading strategy and provide additional confirmation.
Keep in Mind:
Remember that the example presented highlights how the Trend Rainbow indicator can be used. However, like all indicators, it is not a definitive market predictor. Thorough research and backtesting are essential before making any trading decisions. Furthermore, it's crucial to have a solid understanding of the indicator and its behavior. Additionally, incorporating fundamental analysis and considering market sentiment can be vital factors to take into account in your trading approach.
Limitations:
The indicators within the TradeMaster Lite package aim for simplicity and efficiency, while retaining their original purpose and value. Some settings, functions or visuals may be simpler than expected.
⭐ Conclusion
We hold the view that the true path to success is the synergy between the trader and the tool, contrary to the common belief that the tool itself is the sole determinant of profitability. The actual scenario is more nuanced than such an oversimplification. Our aim is to offer useful features that meet the needs of the 21st century and that we actually use.
🛑 Risk Notice:
Everything provided by trademasterindicator – from scripts, tools, and articles to educational materials – is intended solely for educational and informational purposes. Past performance does not assure future returns.
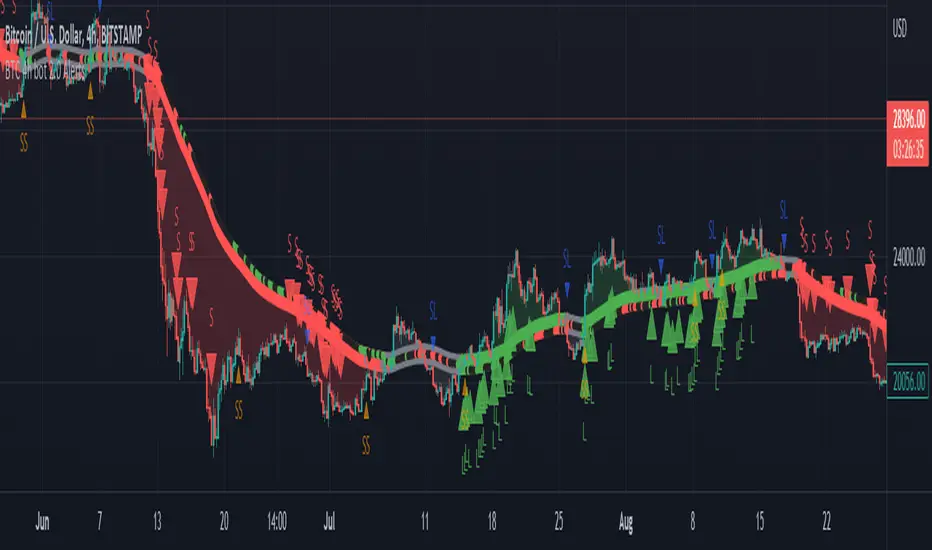
BTC 4h bot 2.0 AlertsThis is Alert version of BTC 4h bot 2.0.
Optimized for pairs BTC vs stablecoins, 4h timeframe.
HOW IT WORKS:
Script is based on the fact that there are certain phases of the market when there is a greater probability that BTC will go to one side or the other. To evaluate which phase we are in, the script uses "Main trend" and "Confirmation signals".
Main trend
- Is composed of a combination of several supertrends and moving averages. A Supertrend is a trend following indicator that helps in identifying whether we are in an uptrend or a downtrend. A higher factor is used to capture the main trend and not just small movements. In case the market goes sideways, the Supertrend does not work well, so it is a combination of multiple supertrends along with moving averages to differentiate a real strong trend from a range.
- It can be seen on the graph as a thick solid line.
- In an uptrend is green, in a downtrend red, gray represents the neutral zone.
Confirmation signals
- Are several script-evaluated indicators such as RSI , MACD , ADX and others, which serve to confirm the trend. In this case, it is the opposite way to the Main trend. Confirmation signals are used here to detect small movements. They are trying to capture bullish and bearish price momentum.
- On the graph they are seen as dashed lines above or below the Main trend (in the gray zone they are in the middle).
- It indicates only two signals, green for buy and red for sell.
HOW TO USE IT:
if the Main trend and Confirmation signals are of the same color, it will send a buy or sell signal, depending on which phase of the trend it is in. If the Main trend is e.g. in an uptrend and the market is going up, Confirmation signals should generate a lot of signals. But if the market starts to go in the opposite direction, Confirmation signals should generate fewer signals or none at all, thus reducing the number of wrong trades. In the gray zone of the Main trend it does not open positions.
To close position is possible to use stop loss and take profit or alternative could be to set very high TP value, thereby letting the script close the positions by itself by Stop Long or Stop Short.
The recommended setting is:
TP: 3.9%
SL: 4.7%.
In this case, it is a Alert version, where can be seen all the signals, which the script generates.
Green triangels indicate open Long.
Red triangels indicate open Short.
Small blue triangels indicate Stop Long position.
Small orange triangels indicate Stop Short position.
Signal is valid after bar is closed, so do not open a position before.
Script works well on Bitstamp, but also other exchanges with pair BTC/USD or BTC/stablecoins.
The script works consistently well over a long period of time, using past probabilities, but this does not guarantee future results.
BTC 4h bot 2.0 StrategyThis is Strategy version of BTC 4h bot 2.0.
Optimized for pairs BTC vs stablecoins, 4h timeframe.
HOW IT WORKS:
Script is based on the fact that there are certain phases of the market when there is a greater probability that BTC will go to one side or the other. To evaluate which phase we are in, the script uses "Main trend" and "Confirmation signals".
Main trend
- Is composed of a combination of several supertrends and moving averages. A Supertrend is a trend following indicator that helps in identifying whether we are in an uptrend or a downtrend. A higher factor is used to capture the main trend and not just small movements. In case the market goes sideways, the Supertrend does not work well, so it is a combination of multiple supertrends along with moving averages to differentiate a real strong trend from a range.
- It can be seen on the graph as a thick solid line.
- In an uptrend is green, in a downtrend red, gray represents the neutral zone.
Confirmation signals
- Are several script-evaluated indicators such as RSI , MACD , ADX and others, which serve to confirm the trend. In this case, it is the opposite way to the Main trend. Confirmation signals are used here to detect small movements. They are trying to capture bullish and bearish price momentum.
- On the graph they are seen as dashed lines above or below the Main trend (in the gray zone they are in the middle).
- It indicates only two signals, green for buy and red for sell.
HOW TO USE IT:
if the Main trend and Confirmation signals are of the same color, it will send a buy or sell signal, depending on which phase of the trend it is in. If the Main trend is e.g. in an uptrend and the market is going up, Confirmation signals should generate a lot of signals. But if the market starts to go in the opposite direction, Confirmation signals should generate fewer signals or none at all, thus reducing the number of wrong trades. In the gray zone of the Main trend it does not open positions.
To close position is possible to use stop loss and take profit or alternative could be to set very high TP value, thereby letting the script close the positions by itself.
The default setting is:
TP: 3.9%
SL: 4.7%.
In this case, it is a strategy to find out how the script worked in the past period. The longest period in which it is possible to test BTCUSD is on the Bitstamp exchange. The script works consistently well over a long period of time, using past probabilities, but this does not guarantee future results.

Multi-Symbol Cross Indicator Template - Unleash Your Potential!Unlock your full trading potential with this powerful and versatile Multi-Symbol Cross Indicator Template! This script is designed to make you stand out from the crowd by enabling you to monitor multiple symbols on a single chart for specific events, such as a Golden Cross or Death Cross. With its high adaptability to include various technical indicators, you're in complete control of your trading decisions and market analysis.
By using the built-in request.security function, this template fetches data for your chosen symbols from the selected exchange and calculates the conditions (e.g., moving average crossovers) for each symbol. Although the current implementation focuses on Golden Crosses and Death Crosses, the sky is the limit when it comes to modifying the script to incorporate other technical indicators such as RSI, MACD, or Bollinger Bands.
You, as a discerning trader, can easily customize the script by selecting your preferred exchange and symbols through input options. This flexibility allows you to monitor your favorite markets without the need for any direct code modification, giving you the ultimate adaptability for various trading strategies and market analysis purposes.
Remember, this script is more than just an example or template; it's the key to unleashing your inner trading genius. While it's not intended to be a standalone trading strategy, it serves as the foundation for you to build upon and create your own customized multi-symbol indicators or strategies. You are awesome, and with this Multi-Symbol Cross Indicator Template, there's no doubt that you're on the path to achieving great success in your trading journey!

Tick based chart [DotH]Version 1.0 - 2nd January 2023
Hi All,
This is my first published indicator, although I have written several hundreds for private use.
Description
Tick based chart
I got intrigued while reading about tick based charts on this page (please note this link/website owner is not affiliated with me) , so I decided to see if it would be possible to recreate this type of chart in TradingView, and here's the results.
This is an implementation for displaying a tick based chart in Trading View. There are benefits to using ticks based candles, as each candle represents the same number of "price moves" rather than an unknown number of moves.
Tick based charts are charts with candles that are rendered in the same way as traditional candles. However, instead of rendering a new candle at a specific time period,tick based candles are rendered after a set number of ticks have occured. For example, in a 50 tick chart, each candle that you see represents exactly 50 ticks, i.e. 50 price changes/moves. Having a view of what happens on the tick level, may help some traders evaluate what is happening within very large candles, or even detect a change in trend, volatility or some other metric which otherwise may not be visible using a standard chart.
Please note that this indicator DOES NOT match/synchronize timewise with the main chart in TradingView. You must view it independently. If you need to see what times are represented in the tick chart, you can look at the custom time labels and X-Axis grid lines in it to get an idea what parts of the tick based chart correspond to the main chart.
Limitations/known issues:
Currently the indicator has been restricted to 100 candles. This is for limiting the line and box usage to a max of 300 objects.
On timeframes above 1 minute, the seconds values will always be 0. In order to be able to see seconds values in the chart scale you need to be on a second level chart, which requires a premium TradingView subscription.
Changing the parameters in the settings will cause the chart to empty and start redrawing from its first candle again. This is because the tick chart is being drawn from realtime data, unlike the standard TradingView charts.
TODOs & Bugs:
Add some moving average indicators (SMA, EMA as a minimum)
Add a corresponding tick based volume chart
Create RSI, MACD, BB variations of this indicator
If you have any ideas/suggestions or bug reports, please feel free to let me know, however keep in mind that I do not have too much spare time to add things, so updates are going to be sporadic.
ABOUT CODE REUSE:
The code is free to use/change. However, if you plan to use this code to make a derivative indicator or strategy, it would be nice to know, so let me know if you feel like it!

Screener RSI,MACD,MACROSS,Stochastic,200MA, BY MK TRADERThis script lets you pick 20 symbols to check for ma crosses. The way it works is it scans all 20 of your symbols for moving average crosses and then it sends an both a regular alert and a visual alert inside of the indicator. I found that ma cross strategies are very popular right now so I thought it would be nice to have one indicator instead of 20 discord servers. The features include: 20 custom symbols, alerts, custom colors, ma select, and custom time frames. If you want to use the custom time frame option, use the lowest time frame possible. That way you wont have gaps.
sohail Anjum EMA buy sellBased on Sohail anjum
Ema crossing teaching
Crossover alerts, only in trend 200 Ema (yellow line) make sure If the price is above the 200 EMA, you can prefer a long position and ignore short positions.
If the price is below the 200 EMA, you are allowed to open only short positions and avoid long positions.
Do not use this indicator alone, Use other recommended indicators by ShohailAnjum Rsi, Macd , chart pattren, etc
This indicator good win rate in 15m TF recommended 1H, 4H
Simple Buy Sell SignalsIt is a simple indicator that provides buy or sell signals based on the intersection of two EMAs and a simple moving average (SMA). once the Relative Strength Index has confirmed it. For greater accuracy, add additional indicators like stochastic RSI, MACD, etc. Use only for intraday trading, Not for Positional Trading

CoinSignals v1.00General description:
This script is designed to determine the further direction of the asset price in the selected timeframe, based on formulas that have their own calculation algorithm. In fact, they are not based on any of the widely known tools. The possible range of operation is from 1 day to 3 minutes, depending on the settings.
CoinSignals v1.00
CoinSignals v1.00
Direction of movement:
When certain indicators of the algorithm are reached, signals appear that are displayed in the form of a triangle directed in a certain direction, green (up) It's long, red (down) it's a short. Also, the entry point to the position will appear on the next candle.
Take Profit Points:
These points are intended for setting limit or stop orders "Take Profit", there are all 3 of them, which does not mean that the price will not go further. They depend on the volatility of the asset and can change up or down.
Stop loss:
This point is given for reference. It is usually used to set a "Stop loss" order. The value of this point also depends on the current volatility of the market.
Rollback/Reversal points:
Displayed as a diamond.
They use multiple divergences to determine the points of a pullback or reversal, they do not use indicators of the RSI, MACD, CCI and others (11 in total), namely divergences arising on these indicators, which are stronger factors for a pullback or reversal.
The red line on the chart is a highly modified moving average, which serves to average the position.

Better Trader Super PredictThis is a free trading assistant that combines 4 types of trading signals and useful tools.
Four types of trading signals:
1. Trending signals. KAMA and Awesome oscillator(5,34) and (3,25) are used to confirm trend.
2. Knifes. This is a SOT detector with volume and spread filtering. The algorythm takes into account the volatility.
3. Predict. The distance from VWAP and BB stdev 2 and 3 is used. Signals usually appear when RSI/MACD/AO divergence is detected.
4. High risk signals. These are SOT and high volume signals without hard filtering.
All signals use distance from SMMA and volatility.
Filters use LL and HH events.
Each signals has entry zone, recommended stop-loss and a number of take-profits.
Recommended entry points and usually located in the body of higher timeframe candles.
Recommended stop-loss zones are using ATR(10) with multiplier that depends on the timeframe.
Take-profit points and arranged within daily and week levels using pivots and VWAP.
The useful tools are:
- Autofibo
- Ichimoku clouds
- VWAP
Disclaimer:
Your trading is fully your responsibility.
Sell and Buy markers are not a financial advice.
Do not take too much risk.
Almost all signals are NOT repainted. There some rare trend signals that can be repainted.

CRYPTO TRADING BOT - 1min SCALPING LONG/SHORTHOW IT WORKS
The core concept behind the script is the determination of the current market mood in sense of creating a trendline indicator using EMA / SMA .
By using this trend indication alongside RSI / MACD value range, we are able to enter/exit the market in both directions: LONG and SHORT .
In case of confirmed false signals, we try to catch up the next good opportunity to minimise loss and to close the current trade.
If the chance for a good countertrade is given at this point, the market is going to be entered reversely.
Should the market move incredibly fast against our trade direction, we use proven Stop-loss targets, to bring our children into safety.
As many others, we could tell you now, that we used state-of-the-art machine learning algorithms
as well as highly sophisticated methods to gain our results.
As a fact, we started with an idea, using simple and common trading tools/indicators,
as a solid ground. We did not want to reinvent the wheel and it paid off.
GET A WORKING SCRIPT
The algorithm we are using has initially been created with a self-developed backtesting software.
To be able to deliver gas to our engine, we have bought a huge amount of OHLCV data for the 1min chart.
After many exhausting and frustrating weeks of our workflow-rotation (develop, fail, fix, test, repeat)
we finally got confirmation for all of our conditions/expectations, so we translated our algorithm into pine-code.
THE RESULTS
Since we have been using our Pine-Strategy alongside our backtesting software , we checked all the results provided by TradingView
and our tool to be 100% sure every outcome, every entry and every exit is exactly the same.
We did this for several months and since 2021 June we have been using it with real Alerts, coped to our binance account.
Below, you will find how the performance for the previous months looked like (every trade was made with 100% of the capital, of course using proper stop loss and take profit):
September 2020: 15.18%
October 2020: 36.17%
November 2020: 15.12%
December 2020: 48.58%
January 2021: 150.10%
February 2021: 45.96%
March 2021: 46.48%
April 2021: 4.96%
May 2021: 43.48%
June 2021: -28.99%
Juli 2021: 15.63%
August 2021 (so far): 11.57%
Accumulated Profit: 1,979.01%
To prove our results, we will link an excel sheet for every trade that was made within this timerange.
Link: docs.google.com
ABOUT US
We are two good friends, both incredibly interested in mathematics, software engineering, AI and algorithmics. After getting introduced into the crypto space
by a common friend, we started figuring out that there is a pattern behind every big or small move which happens in an asset.
This is where the passion for creating a CRYPTO TRADING BOT began. It was our goal, to create this script for the 1min Timeframe, so the software can react quickly when a
big or small move is happening - this is why it is called a SCALPING SCRIPT .
We are incredibly proud of this script and would like to share it with this amazing community - just hit us up on TradingView!

Bull and Bear Marubozus Candlestick PatternMarubozus are an interesting candle pattern wherein the close and open of the candle are also the high / low points of the candle. In other words, a candle with no shadows or wicks.
How reliable are they, though? Probably not very reliable on their own. It may also depend on the size of the candle. You would probably want to incorporate this candle pattern with other filters, like RSI, MACD, to filter trade opportunities.

Top Scalping Indicator with Trend & S/RINTRODUCTION
---------------------
Welcome Traders, this is a custom indicator created specifically for scalping stocks, commodities, currencies, and cryptos where there is usually high volatility and momentum. This indicator is a fusion of three specially coded indicators.
1) Custom Dynamic Trend Line
2) Custom Buy and Sell signals
3) Support and Resistance lines
The trendline and the buy/sell scalp signals are based on RSI, MACD, Stochastics values, and the past volume of the security. There is also an ATR inbuilt which allows you to ride the trend. All values can be tweaked according to your trading style. After choosing the desired values, a trendline and buy/sell signals will be generated providing you with various trading opportunities.
Finally, the S/R levels help you to take better confluence trades.
HOW TO USE THIS INDICATOR
-------------------------------------
To make the most of this indicator, deploy it on your chart, wait for a buy signal when the candlestick breaks the trend line from below and take a trade after it closes above the trendline, with previous candles low as to stop loss. Similarly, take a short when the candle cuts the trendline from above and closes below. Maintain a 1:1 or 1:2 risk to reward ratio for net positive results over time. My suggested time frame for trading is 3m, 5m, and 15m, but it may be used on higher time frames as well depending on your strategy and trading style.
The above strategy is just a suggestion from personal experience. As this indicator is a confluence indicator that takes into account various technical values, it is best to back-test this strategy or create your own through the tools provided in this indicator.
Happy Trading!!
